
Screen markets, test strategies, and connect trading with review.
Start with candidate markets, form a research question, then read backtest results and execution records. Explore this workflow through three steps in the real interface.
Start with market filters and mini candlestick charts, or explore AI market direction estimates.
Real macOS application windows. Choose a workflow stage to explore its full interface and concrete uses.
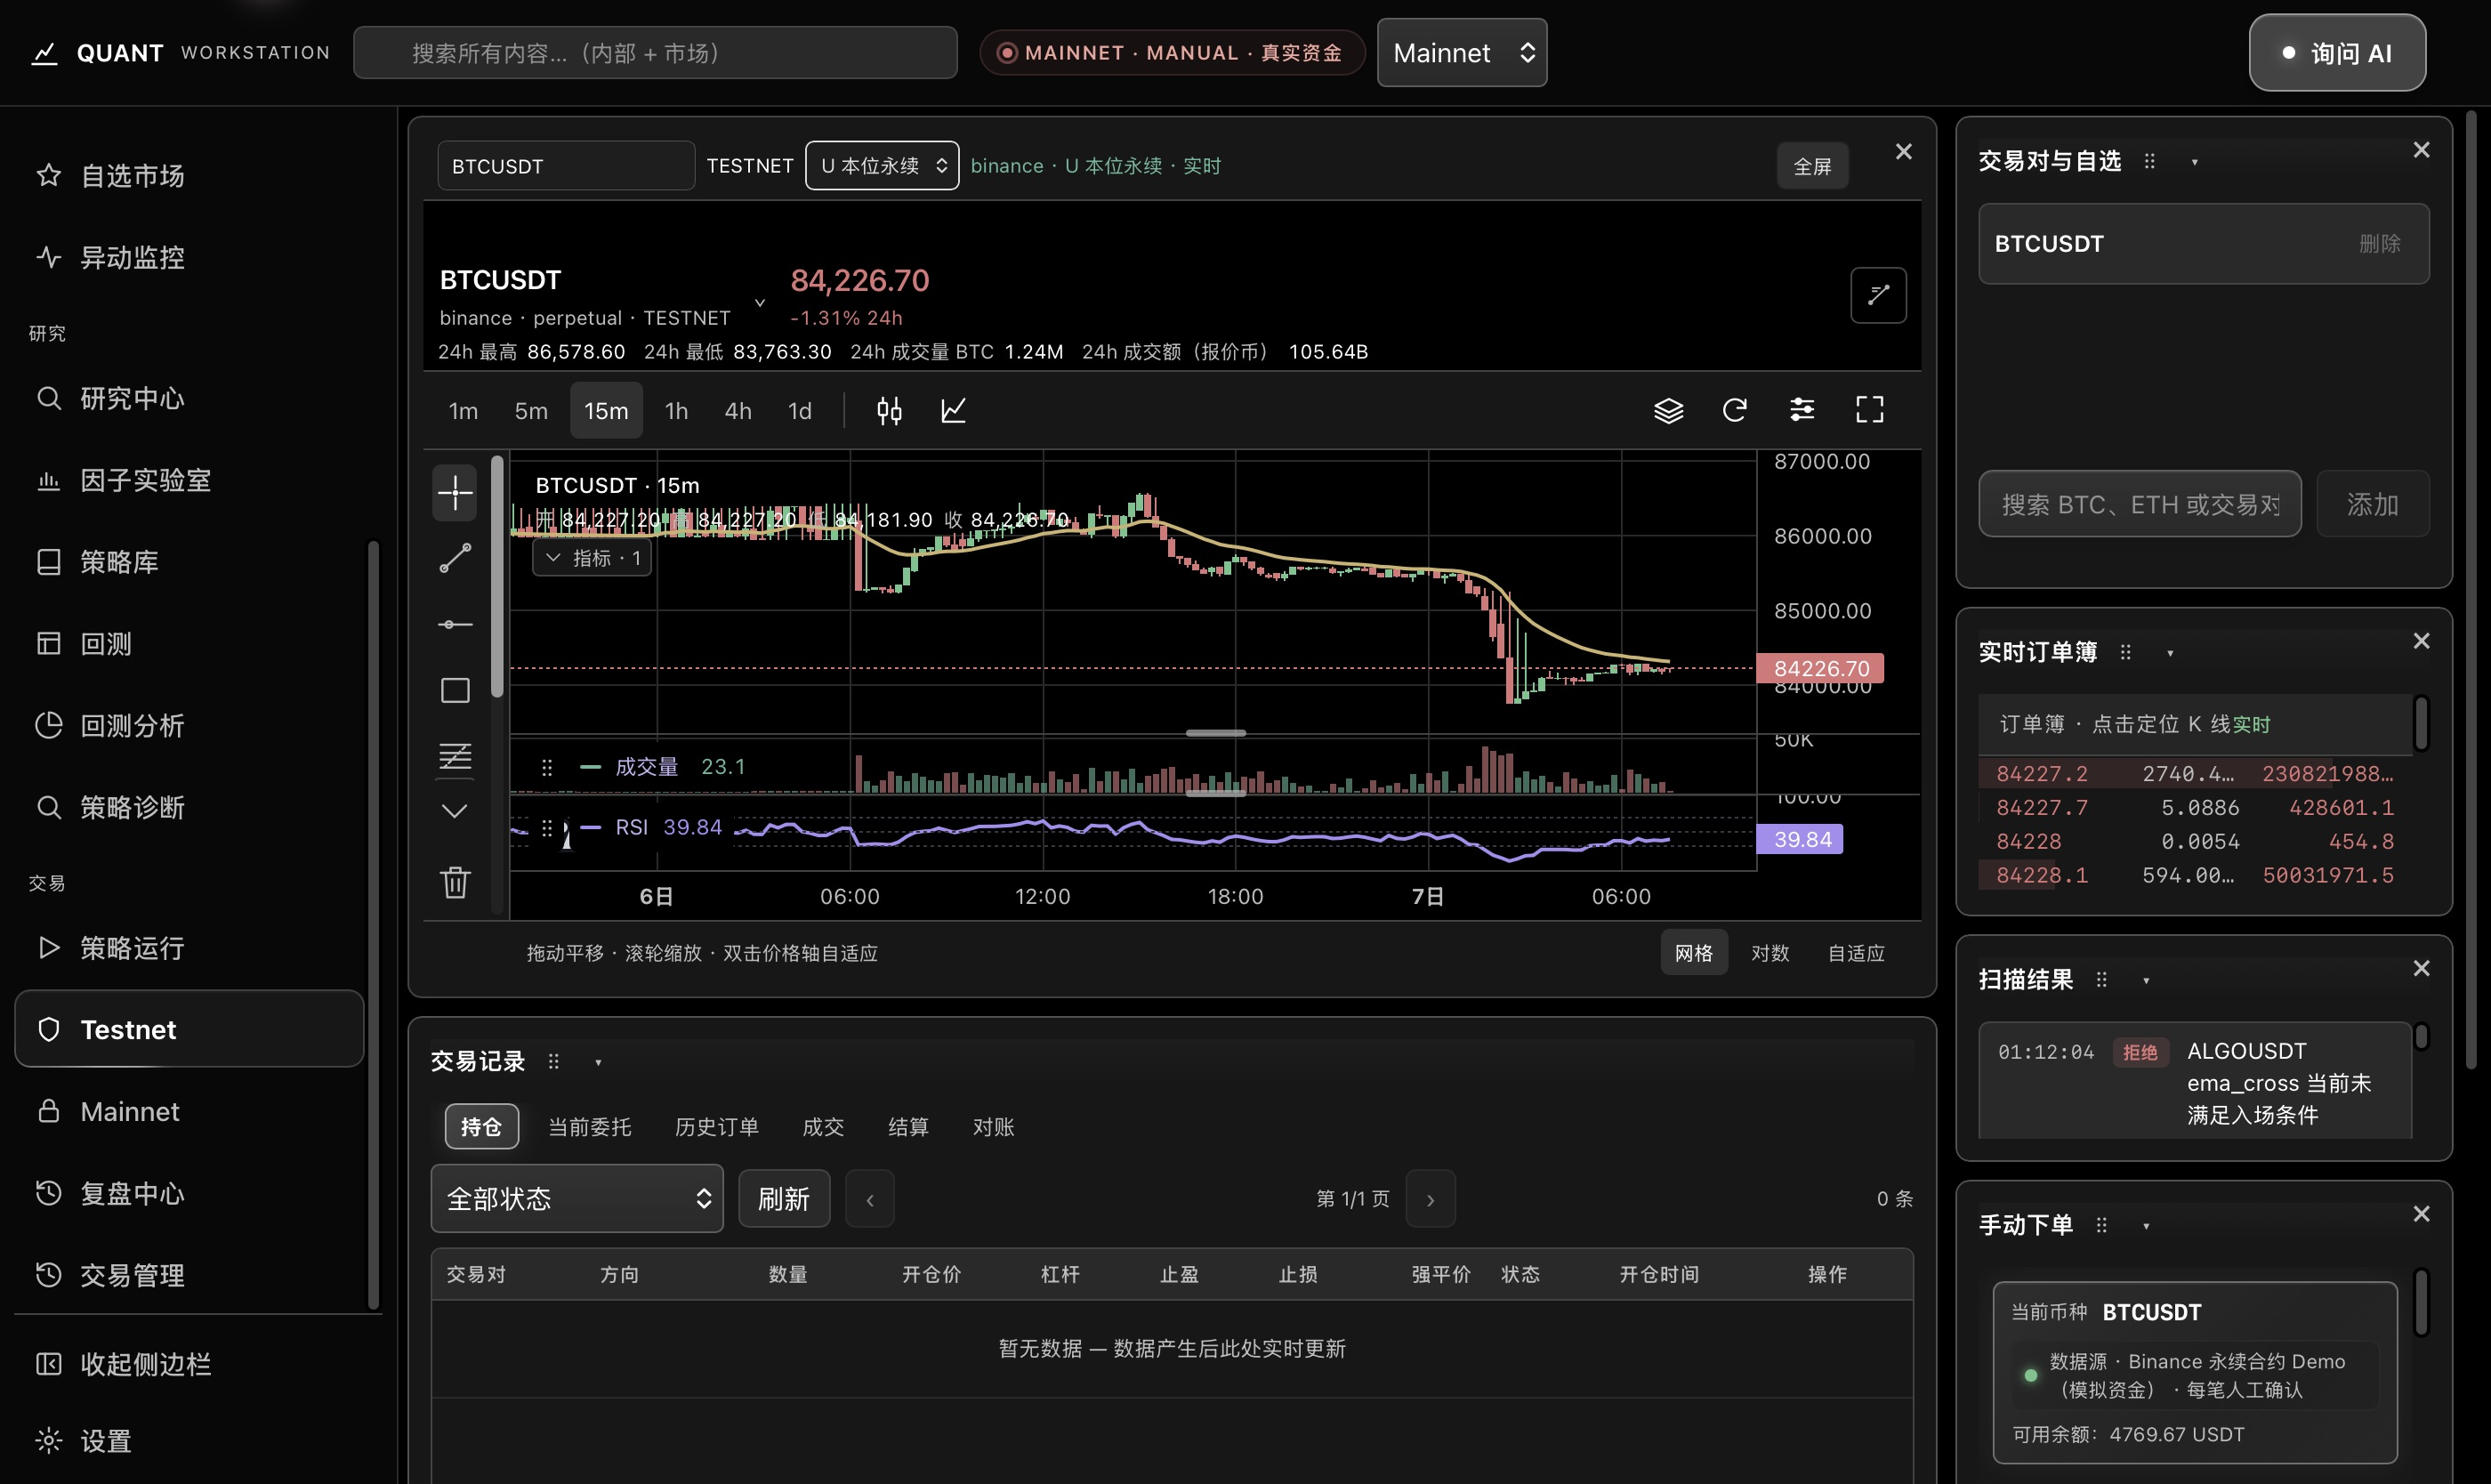
Upper view of the actual Testnet trading page, showing its chart, watchlist and scanner.
Turn a chart observation into a research question.
Read price and its moving average, then compare volume and RSI. Use the observation to form a question you can test.
Price structure
Keep the observation in context as you change timeframe
For example, inspect candles and price movement in the BTCUSDT 15-minute chart, then compare another timeframe. Turn the observed structure into a question you can test.
Moving average reference
Read price and indicators together
Select the indicators you need and compare price with its moving average. The chart, watchlist and live order book share a workspace for continued observation.
Volume and RSI
Compare volume and momentum alongside price
Read volume and RSI with the main chart for the same period. Different indicators provide different angles for narrowing a research question.
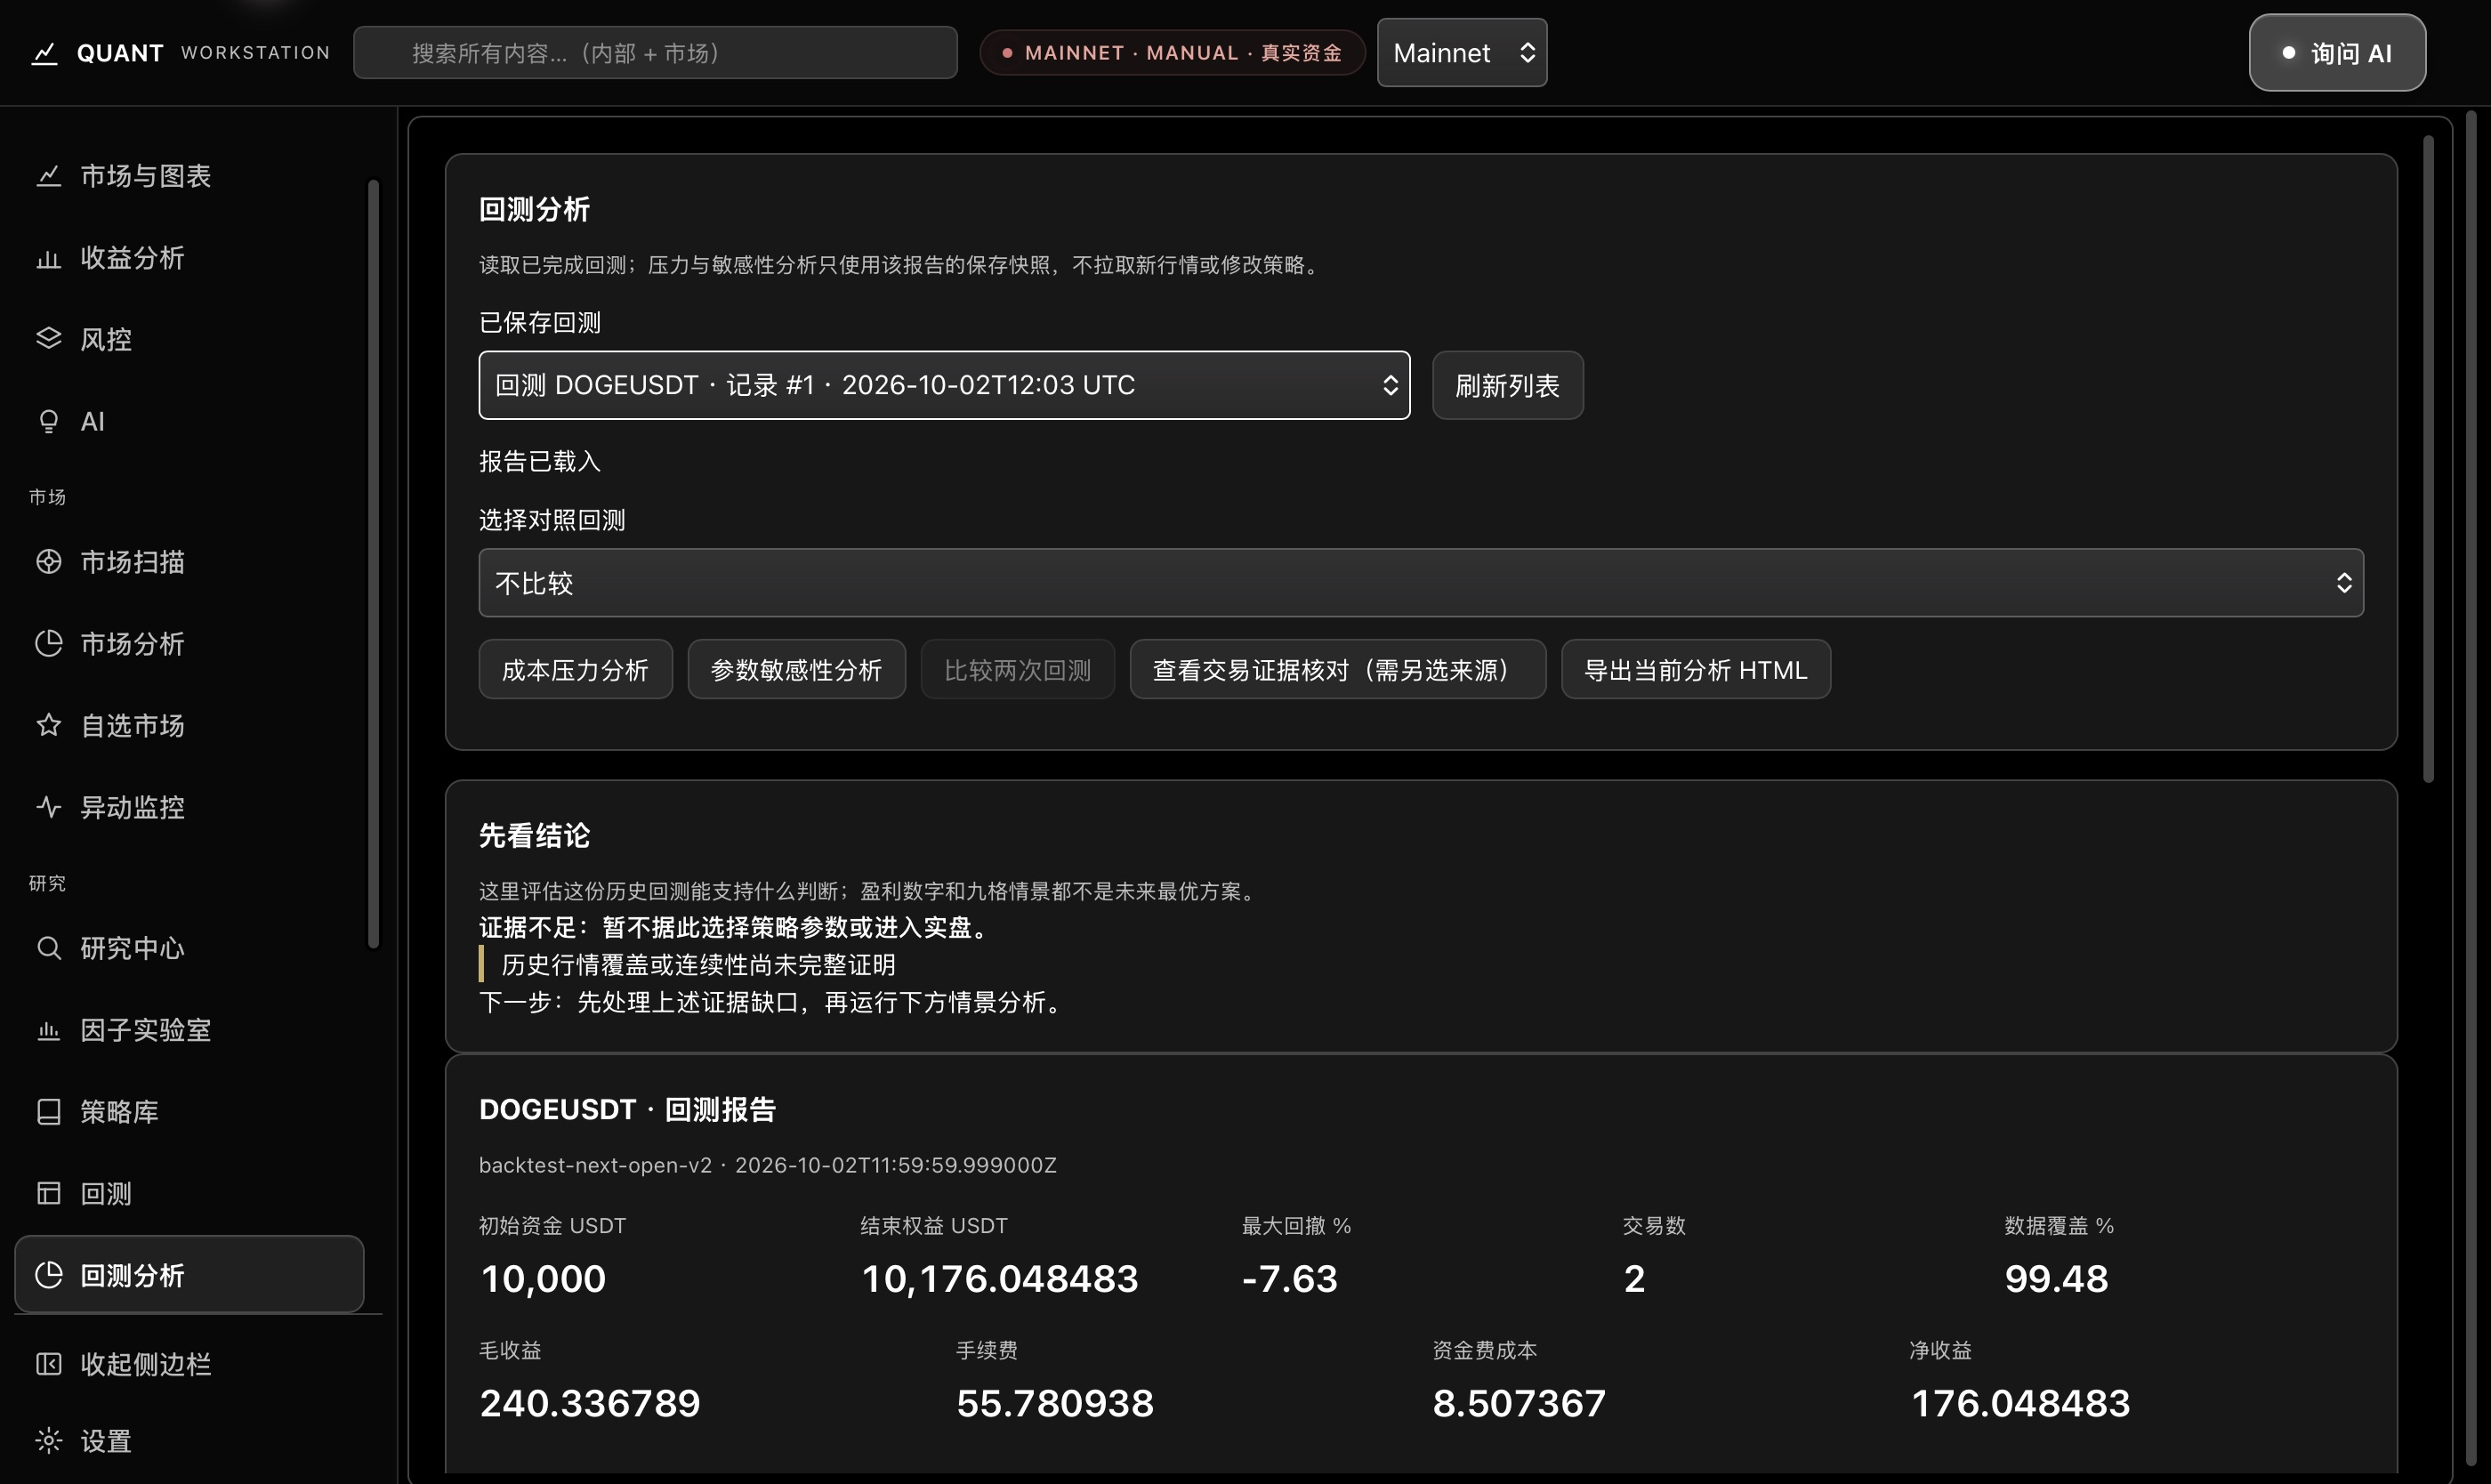
A saved historical backtest report. Its original results and insufficient-evidence notice remain visible for review.
Read performance, risk and costs together.
Read a saved report with its equity, drawdown, costs and data coverage together. Check the evidence limits before using the result.
Equity and drawdown
Read performance and risk from the same report
The saved DOGEUSDT report lists starting capital, ending equity, maximum drawdown and trade count together. Read the outcome with its risk, then compare another saved test.
Costs and net result
Include costs in strategy validation
Fees, funding costs and the net result are shown separately. Continue with cost stress and parameter sensitivity analysis using the report’s saved snapshot to compare changing conditions.
Data coverage
Keep the limits of the evidence visible
Data coverage appears alongside the conclusion. This historical report shows an insufficient-evidence notice; check coverage and continuity before deciding how to use the result.
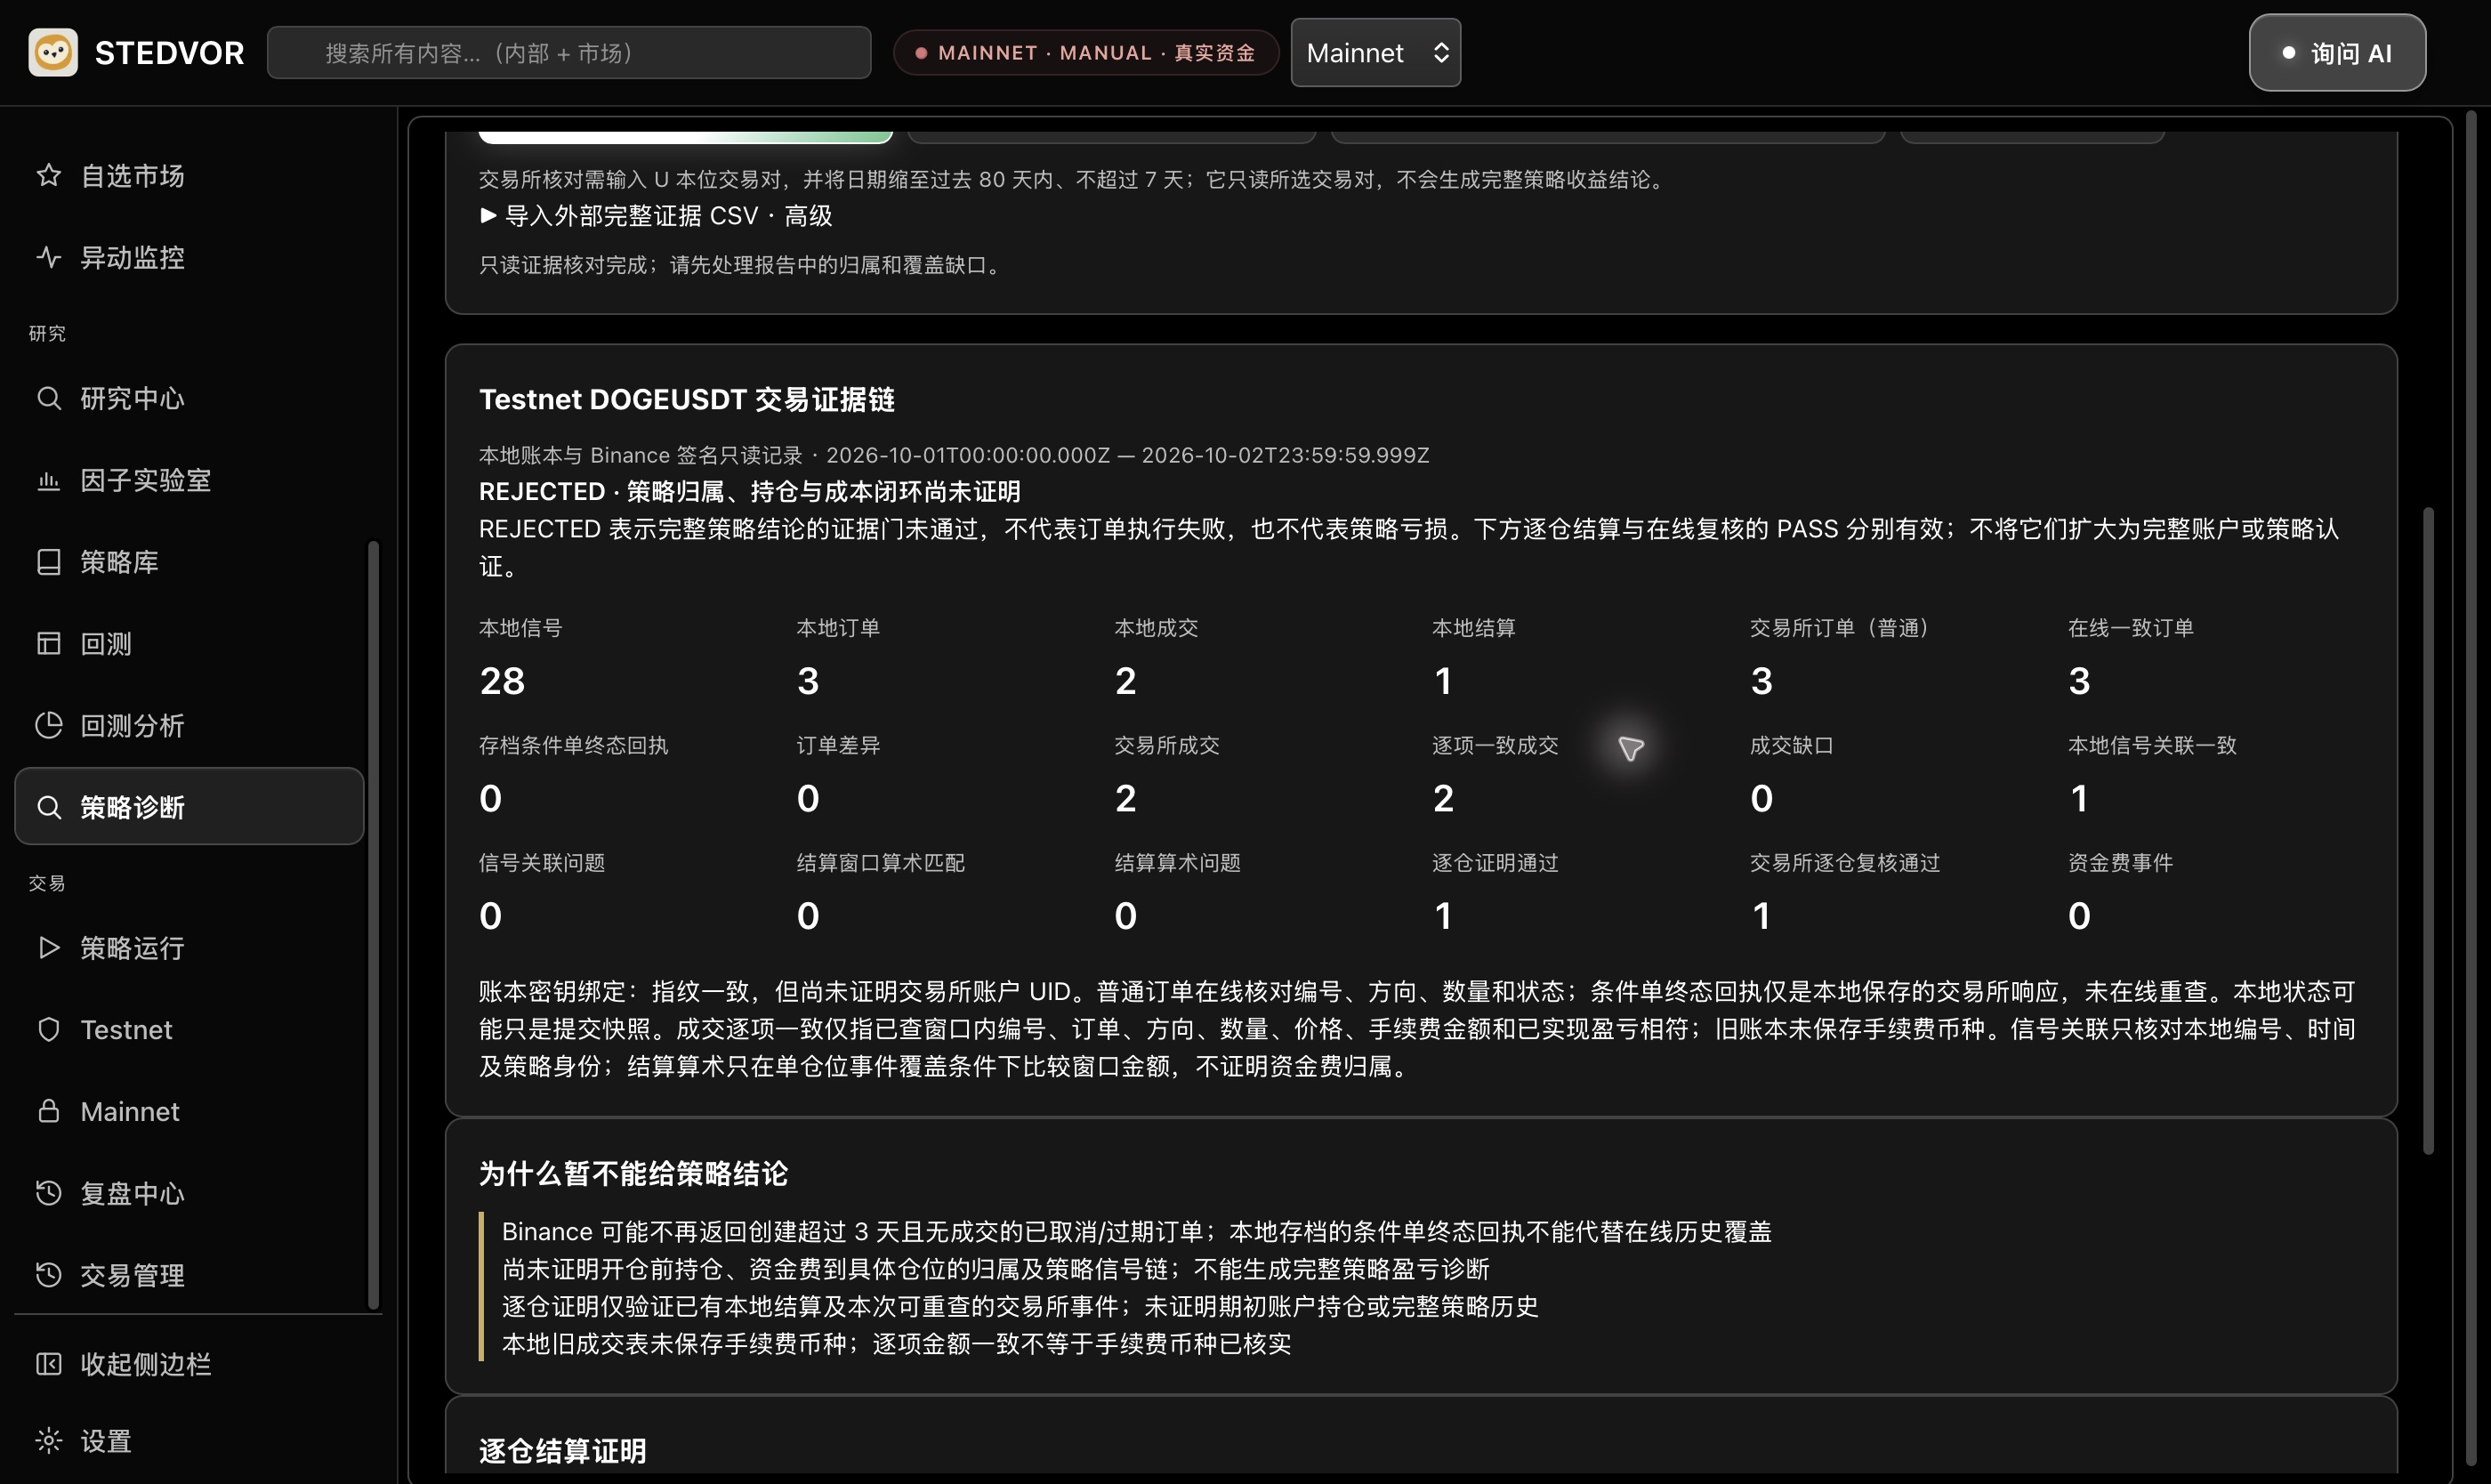
Actual read-only Testnet DOGEUSDT results. The native header retains its environment display; this check concerns Testnet.
Per-position settlement and exchange recheck · Full lower window
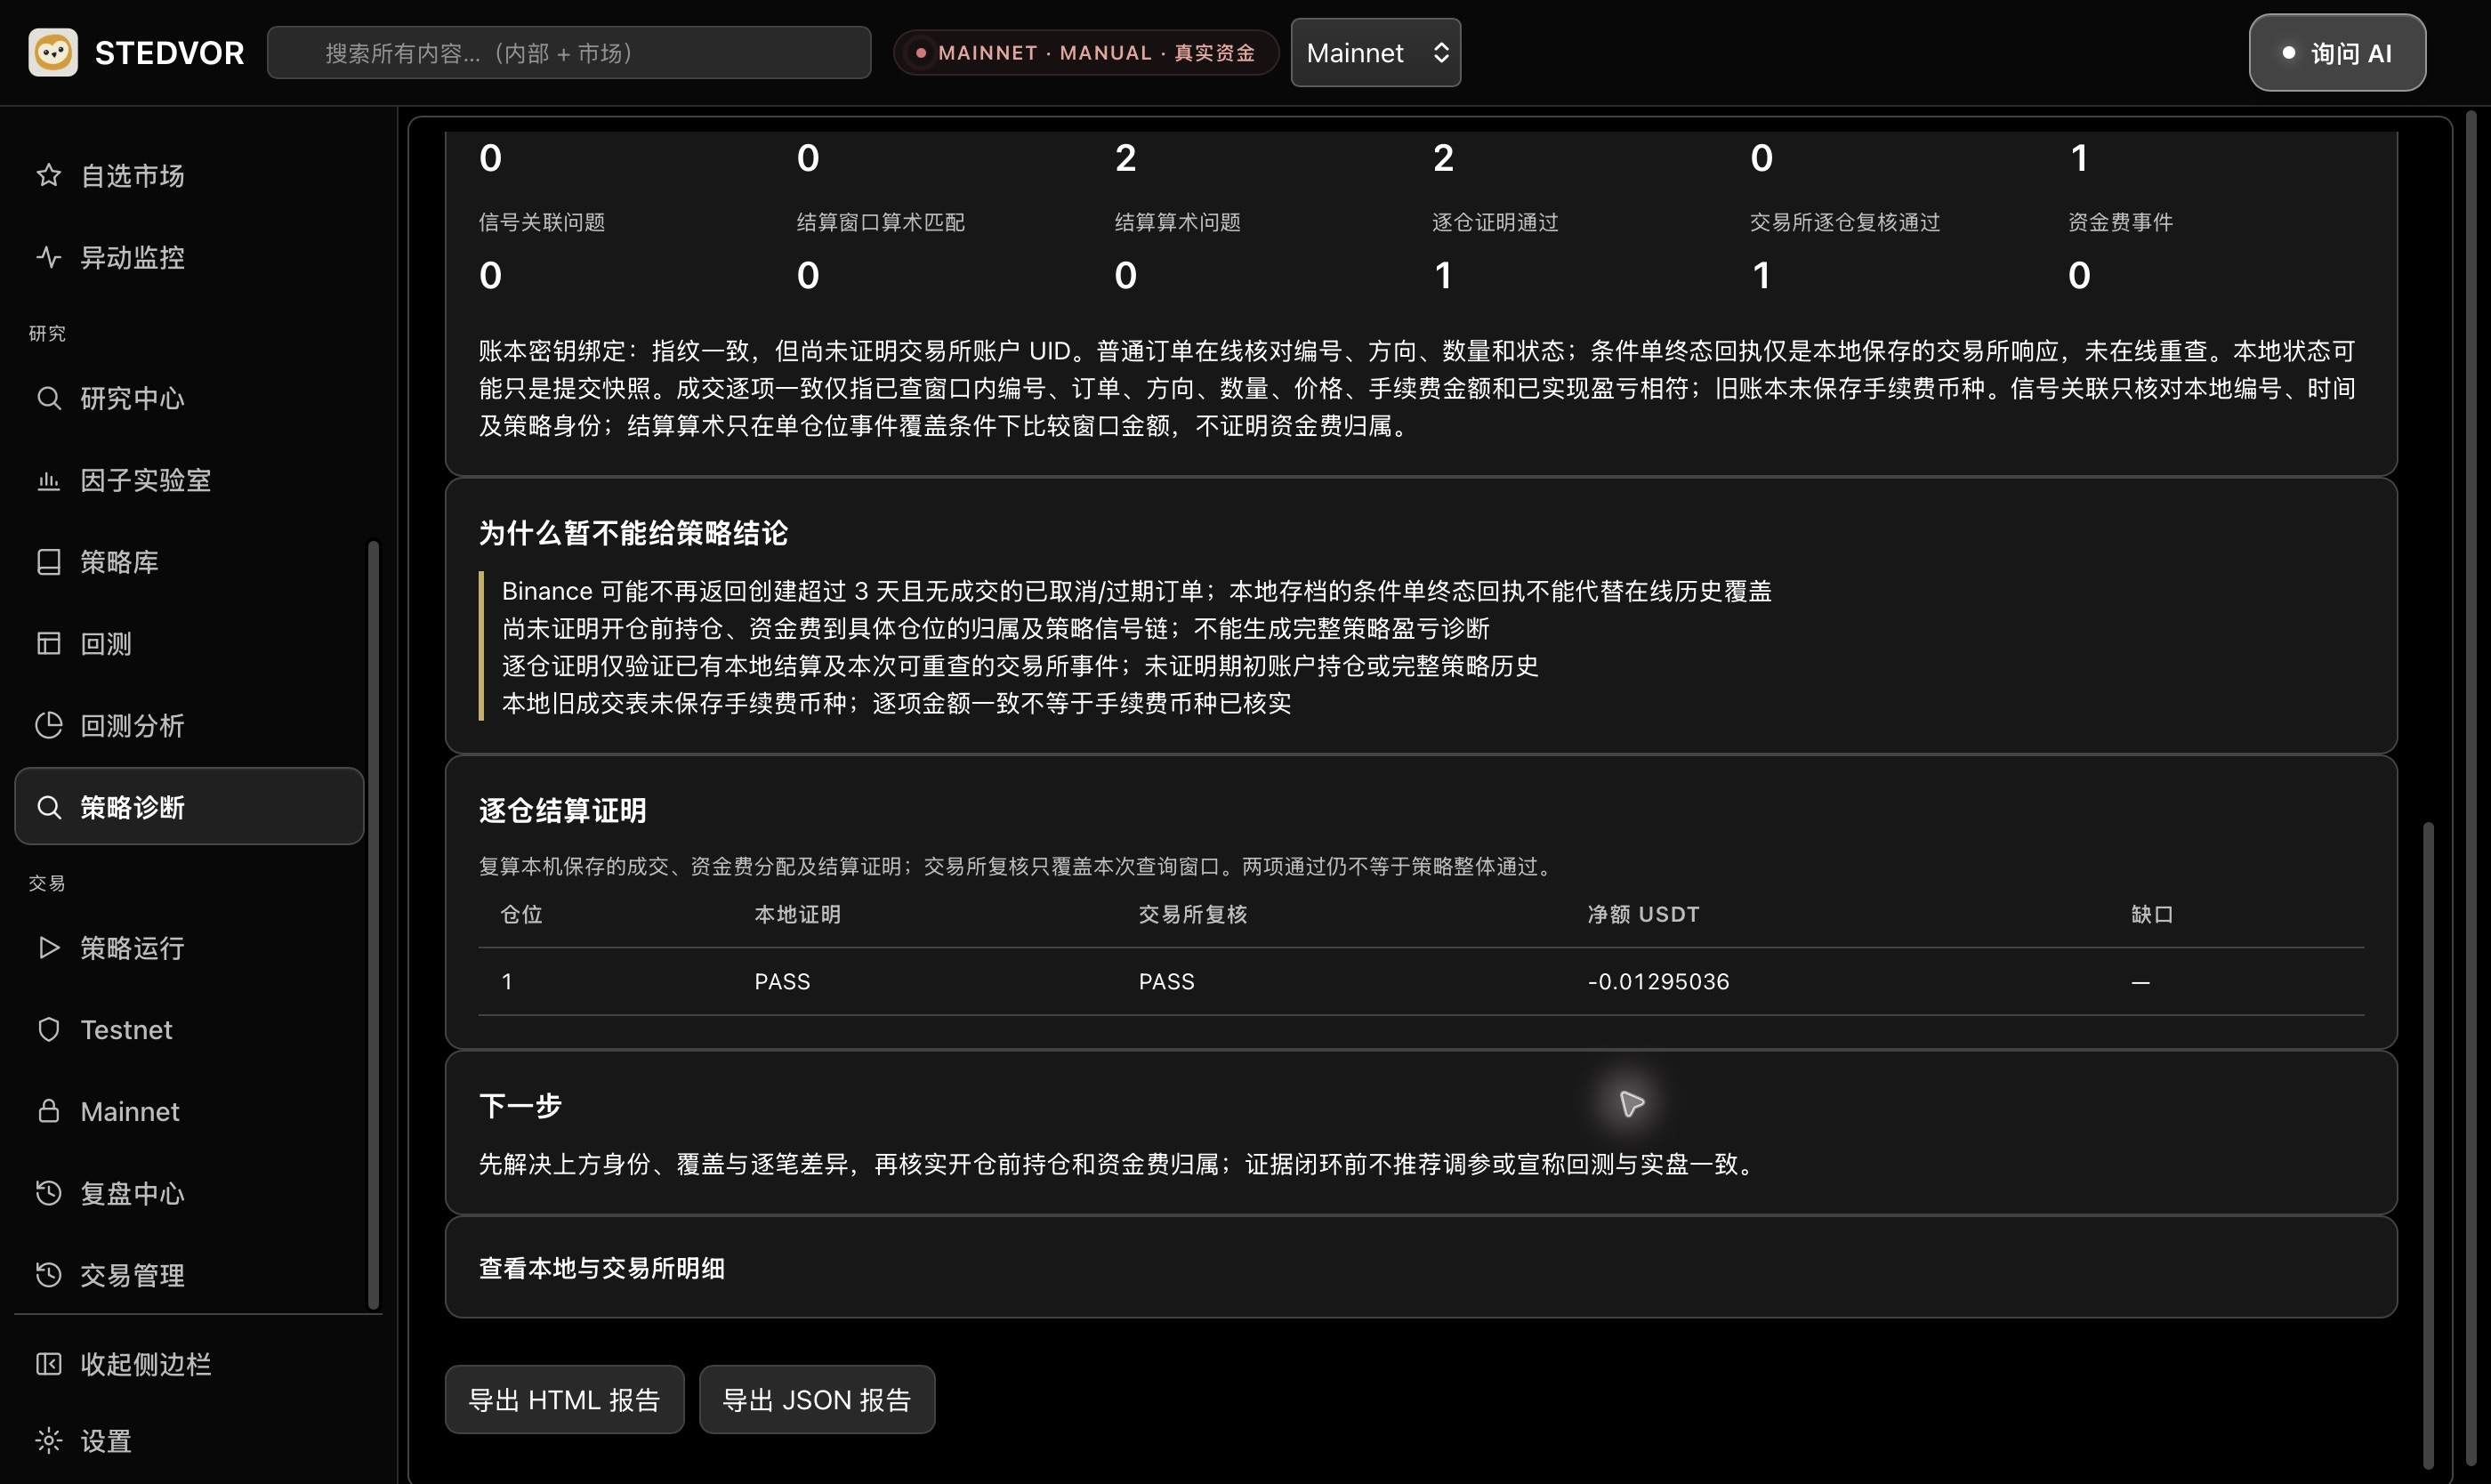
One per-position settlement proof and its exchange recheck both show PASS. Evidence gaps and report export controls remain visible. These checks do not establish full strategy validation.
Carry checked records into the next review.
Read orders, fills and per-position settlement together. Retain confirmed information and evidence gaps, then continue the review within that scope.
Orders and fills
Compare actual local and exchange records
This DOGEUSDT check matches three orders and two fills item by item, with zero differences. A defined record scope lets the review return to specific evidence.
Per-position settlement
Read the settlement proof and exchange recheck separately
One per-position settlement proof and its exchange recheck both show PASS. The full lower window shows both results; they apply only within the available evidence.
Evidence gaps
Keep the scope clear before a full strategy review
The overall strategy result remains REJECTED: opening positions, strategy linkage, historical coverage and funding attribution remain incomplete. Export the report to continue the check. This does not indicate a failed order or a losing strategy.
From market screening to your next strategy test.
Narrow candidates with filters and mini candlestick charts, and use AI direction estimates as another research input. Explore one-click backtests, parameter comparison and factor return testing, then review trading and risk records.